The problem: we don’t measure operational risk
Imagine you’ve joined a new company. You’re immediately tasked with shipping a bugfix this week.
You dive into the codebase, find what you need to change, update the tests, and check the dashboards to make sure the system is stable before deploying. You get your code reviewed, merge, and ship.
Minutes later, everything is on fire.
Another team is paging you because their systems broke, which broke a number of other subsystems that depended on them. You roll back. You have no idea what you did wrong. Your teammates are confused too. The only alert you received was the page from a team you had never met.
During the postmortem, a new rule appears: you must coordinate with Team C before making changes to avoid breaking their services. They are added as codeowners and begin blocking reviews. Development slows. A few months later the review gate is quietly removed to speed things up.
The dependency between the two systems still exists.
The issue was not that the code was not reviewed enough. The issue is that the system was fragile.
This post proposes a framework for continuously measuring operational risk.
Modern engineering teams are good at measuring:
- Availability
- Latency
- Errors
- Resource utilization
These metrics describe whether a system is currently working.
They do not describe:
- How risky the next change is
- How fragile coordination has become
- How likely incidents are to cascade
Dashboards answer:
Is the system healthy right now?
Operational risk asks:
How dangerous is the next deploy?
These are fundamentally different questions.
Health is a state. Risk is a trajectory. A system can be healthy and extremely risky at the same time.
Observability tells us when systems fail. In my experience, we rarely measure how likely they are to fail.
From tribal knowledge to empirical signals
Every organization has someone who just knows which services are fragile. They maintain the historical context of why the system is the way it is. They remember the outage from two years ago, the migration that almost broke everything, the API that nobody should touch without a full team sync.
This knowledge is valuable, but it is:
- Informal
- Non-transferable
- Lost when people leave
This post is not about how to manage or reduce this risk. That is a separate and much larger topic.
The first problem is simpler and more fundamental:
How do teams even know where the risk is unless someone tells them?
The goal here is to convert tribal knowledge into measurable signals so teams know where to focus attention before incidents happen.
From code complexity to system complexity
Software systems evolved from:
- Single programs
- Monoliths
- Distributed services, including microservices
- Organizational structures and processes
Today’s failures rarely live in a single codebase. They emerge from:
- Service dependencies
- Runtime behavior
- Human coordination
Operational risk lives in the system graph and the source code. These ideas become especially powerful once we start turning them into metrics.
Code metrics as leading indicators
In source code, operational risk appears as tightly coupled modules that resist change.
Robert Martin formalized this with package coupling metrics: afferent coupling (who depends on you) and efferent coupling (who you depend on). These metrics quantify dependency relationships and predict where change amplification is likely to occur.
I find it easier to think in simpler terms:
- Inward coupling — how many things depend on this thing.
- Outward coupling — how many things this thing depends on.
At the code level, we can count import statements and module references.
| Metric | Formula | Description |
|---|---|---|
| Inward | Count of distinct internal callers | Modules that depend on this module |
| Outward | Count of distinct callees | Modules this module depends on |
| Instability | Outward / (Inward + Outward) | 0 = stable, 1 = unstable |
High inward coupling means changes here are risky. They ripple outward to everything that depends on you.
High outward coupling means you’re sensitive to upstream changes. When your dependencies break, you break.
Instability is a ratio. A score of 0 means everyone depends on you and you depend on nothing. A score of 1 means you depend on everyone and nobody depends on you.
I’ve been working on a tool called uda (universal dependency analyzer) that measures these at the code level. It uses tree-sitter to statically analyze a codebase and produces instability scores for packages based on imports. It also enables drilling down to see granular coupling information.
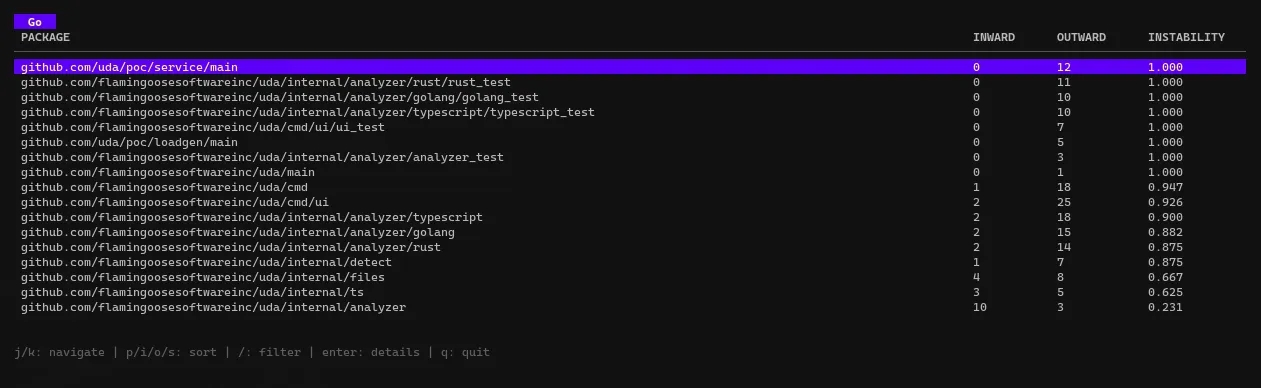
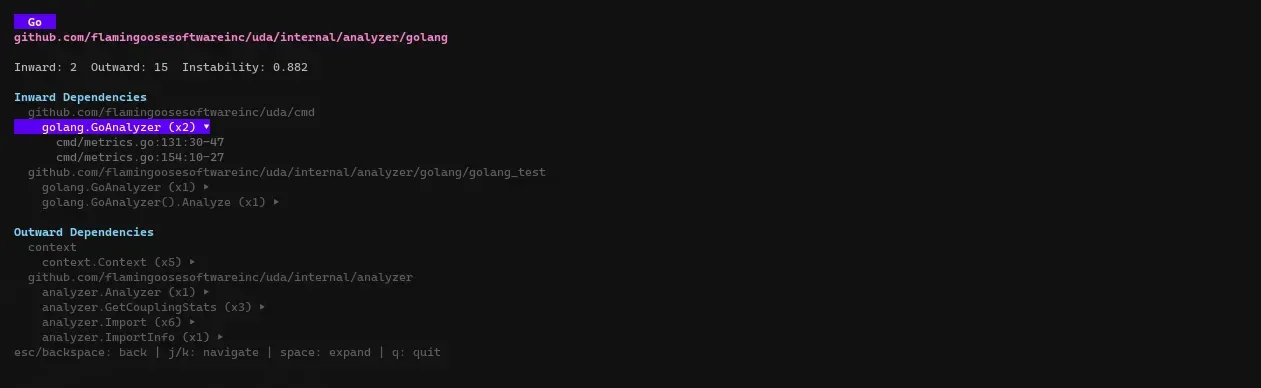
These patterns turn raw coupling metrics into actionable refactoring signals and help prioritize where to focus engineering effort.
| Pattern | Signal | Action |
|---|---|---|
| High inward, low instability, concrete | Zone of pain | Extract an interface |
| High inward, low instability, interfaces | Healthy abstraction | Protect with tests |
| High outward, high instability | Implementation package | Expected for leaf nodes |
| Low inward, low outward | Isolated | Check if dead code |
| High inward, high outward | Hub | Consider splitting |
From static code to runtime systems
The next step is measuring it dynamically in running systems. The same structural patterns that make code hard to change also make systems hard to operate.
Operational risk emerges from three forces:
- Change
- Dependencies
- Coordination
The same concepts from code apply to services:
| Metric | Formula | Description |
|---|---|---|
| Inward | Distinct callers | Your dependents |
| Outward | Distinct callees | Your dependencies |
| Instability | Outward / (Inward + Outward) | Position in graph |
| Fanout ratio | Outbound RPS / Inbound RPS | Request amplification |
Fanout ratio deserves attention. If every inbound request generates three outbound requests, your fanout is 3. You’re amplifying load downstream.
The missing piece is treating this as continuous operational risk measurement—not a one-time audit or a diagram that goes stale, but a living view of how system structure affects the ability to change and recover.
From observability to operational risk dashboards
Observability platforms already build dynamic service maps. But beyond highlighting relationships, they rarely surface metrics that quantify dependency risk.
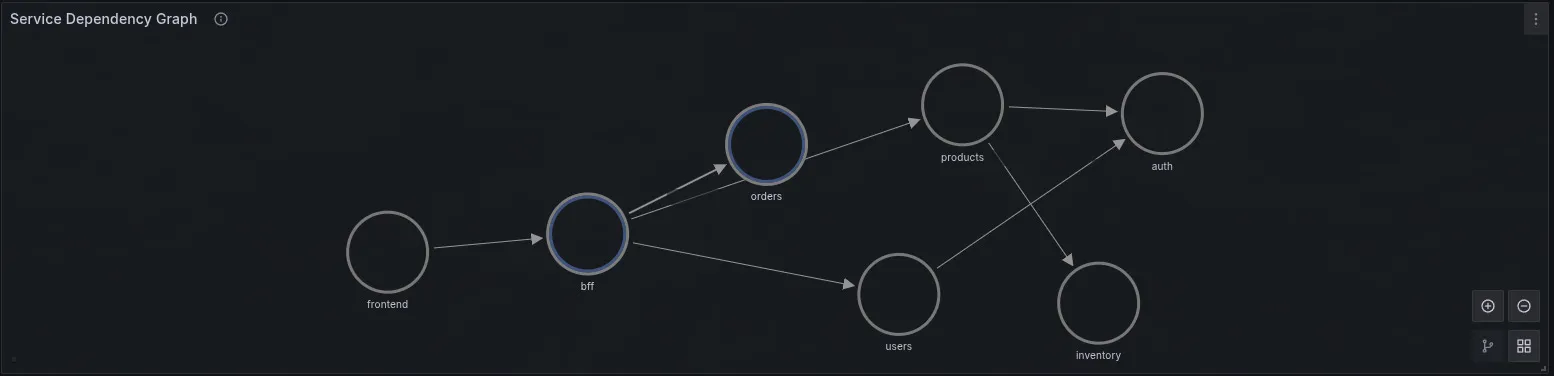
Here is what a typical dynamic service map looks like in practice:
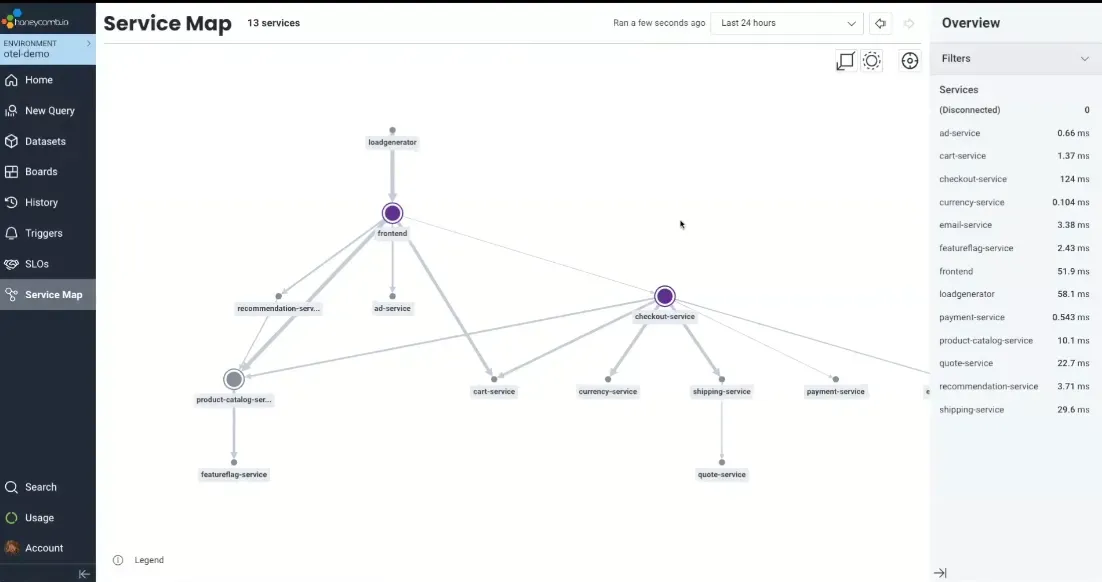
This map shows relationships, but it does not quantify risk.
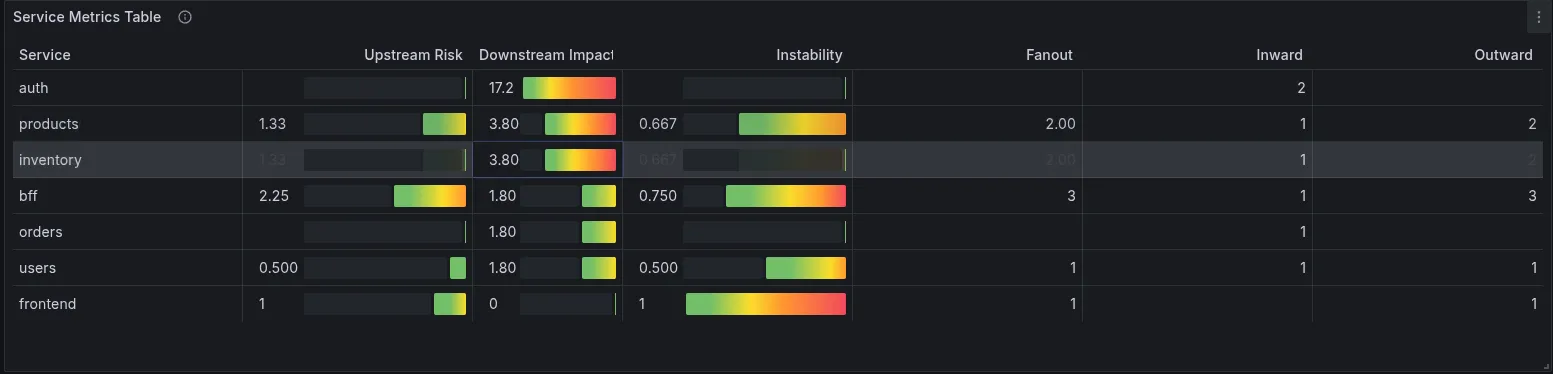
To explore this gap, I built a proof-of-concept monitoring dashboard using Prometheus and Grafana.
Services with high upstream risk and downstream impact quickly become visible. These are the services most likely to both propagate failures and affect many dependents.
Measuring operational risk
Two risk lenses emerge from these metrics.
Downstream impact measures blast radius. If a service has high inward coupling and high traffic volume, its failure affects many dependents. This is the classic “everyone dies if auth goes down” scenario.
Upstream risk measures propagation likelihood. If a service has high instability and high fanout, it’s likely to propagate upstream failures back to its callers.
Visual placeholder: downstream impact and upstream risk matrix, possibly rendered from LaTeX.
Services that score high on both are critical. They amplify problems and affect many dependents.
How to use these metrics
These metrics are most useful when treated as ongoing operational signals. Treat them as continuous signals to guide resilience work, refactoring, and prioritization.
| Pattern | Signal | Action |
|---|---|---|
| High inward, low instability | Critical infrastructure | Circuit breakers, redundancy |
| High outward, high instability | Edge/orchestration | Timeouts, retries, bulkheads |
| High fanout ratio | Request amplifier | Isolate failures; fail fast and recover fast |
| High downstream impact | High blast radius | Prioritize availability |
| High upstream risk | Failure propagator | Degrade gracefully |
| Low inward, low outward | Isolated | Check if orphaned |
| High inward, high outward | Hub service | Consider splitting |
Change amplification becomes coordination amplification
Shipping software is a coordination problem.
Ousterhout describes change amplification as a code smell: when a single conceptual change requires modifications across many modules.
At the service level, change amplification becomes coordination amplification. A small technical change requires multi-team coordination.
The organizational cost of change follows the same graph as the technical dependencies. Risk increases with:
- Number of teams involved
- Ownership ambiguity
- Cross-service deploys
- Manual handoffs
Reducing operational risk often means simplifying coordination.
Failure modes follow the same graph
The dependency graph that determines change risk also predicts failure propagation.
Changes propagate through the dependency graph. Failures propagate through the same graph. Cascading failures don’t happen randomly. They follow edges in the graph. A timeout in one service becomes a resource exhaustion in another. Retry storms amplify instead of recovering.
The deploy graph and the incident graph are the same structure. The structure you see at design time is the structure that constrains you at incident time.
Understanding this graph enables:
- Predictive risk measurement
- Safer deployments
- Faster incident response
Closing thoughts
We have entered an era where AI agents help us produce more code and more services than ever.
As software production accelerates, operational risk compounds. More services means more edges in the graph. More edges means more failure paths and coordination overhead.
To keep pace with accelerating software production, operational risk must be measured continuously. We need to move from tribal knowledge to measurable signals.